


Executive Summary: Replacing manual business verification with an API is the single largest operational efficiency lever an alternative lender, fintech, or B2B credit team has available in 2026. The fully-loaded cost of one manual verification (FTE time, overhead, audit-artifact gaps, deal-velocity drag) lands in the $3 to $8 range; the API equivalent lands at $0.10 to $0.50 plus residual edge-case handling. The harder transformation is not the unit cost but the workflow shift: same-day funding becomes real, audit defensibility becomes structural rather than aspirational, and verification team responsibilities reshape from rote lookups to edge-case analysis. This guide is the case-for-change document for the operations leader making the pitch to leadership.
How to Replace Manual Business Verification with API: A 2026 Transformation Guide
Manual business verification is a workflow built around the constraints of 2010, run on the budget and headcount of 2026. It scales linearly with application volume, fails the audit-defensibility bar bank partners now apply, and produces a per-verification cost that is two-to-three orders of magnitude higher than the API alternative. The replacement is not technically hard. The decision-making is.
This guide walks through the four questions an operations leader has to answer before the migration starts:
1. What does manual verification actually cost? Fully loaded, including overhead, audit gaps, and deal-velocity drag.
2. What changes when you replace it with an API? Workflow, KPIs, team responsibilities, audit posture.
3. What is the ROI math the CFO will challenge? Conservative, defensible, with a clear payback window.[11]
4. What does a successful replacement look like in year one? Concrete year-one milestones the leadership team can hold the operations function accountable to.
The mid-migration playbook (pilot, cohort rollout, KPI tracking, change management) is covered separately. This piece is the pre-migration document: how to build the case and frame the decision before procurement signs the contract.
Why "Replacement" Is the Right Word, Not "Augmentation"
Operations leaders sometimes pitch the change as "augmenting manual verification with API support." That framing produces a worse outcome: the team runs both workflows, the API becomes optional, and the audit-artifact gaps the manual process produces never go away. Replacement is the right word and the right operating model. Manual remains for edge cases (and that is meaningful, 6 to 12 percent of volume). For the routine 88 to 94 percent, the API is the system of record.[2]
Why the CFO Conversation Has to Lead With Audit, Not Speed
Speed is the easiest pitch and the weakest budget defense. Same-day funding is a competitive advantage, but a competitive advantage is harder to put on a budget line than a compliance gap. The CFO conversation that funds the migration leads with audit defensibility (the bank-partner third-party-risk review is the closing argument) and uses speed and cost as supporting evidence.[10]
What Does the Manual Verification Workflow Actually Cost?
The fully-loaded cost of manual verification is rarely calculated honestly because the cost is distributed across line items the operations leader does not directly control. The honest calculation includes seven components:
• FTE time per verification. 5 to 15 minutes of analyst time per file, including the SoS lookup, the UCC lookup, the OFAC screen, and the screenshot capture for the loan file.
• Loaded FTE cost. Salary plus benefits plus overhead plus management. A $60K-base verification analyst costs the company roughly $90K to $110K fully loaded, which works out to $45 to $55 per hour or roughly $4 to $13 per verification at the time-per-file estimate above.
• Same-day funding drag. Applications that miss the same-day funding window because verification was the bottleneck. Each missed deal costs the company the deal margin, which for an MCA shop runs $500 to $5,000 per file depending on size.
• Audit-artifact gaps. Manual screenshot capture is inconsistent in practice; 40 to 70 percent completeness is typical. The cost is paid in audit-finding remediation work and bank-partner third-party-risk escalations.
• Defect rate. 1 to 3 percent of defaults trace to a verification miss in pre-automation portfolios. On a $50M annual originations book at a 4 percent default rate with verification-attributable defects representing 2 percent of those, the annualized cost is $40,000.[1]
• Training and turnover overhead. Verification analysts who burn out on the rote workflow turn over more than other operational roles. Replacement cost (recruit, train, ramp) typically lands $15,000 to $30,000 per departure.
• Audit and exam preparation cost. The lift to assemble a coherent verification audit packet for an examiner from manual records is measured in weeks of compliance-team work; the API equivalent is a query.
Add those together and the fully-loaded cost of one manual verification lands somewhere between $3 and $8 once you stop treating audit prep, deal-velocity drag, and defect rate as someone else's line item. The API equivalent is $0.10 to $0.50 vendor cost plus residual FTE on the 6 to 12 percent edge-case tail.
Where Manual Verification Hides Cost in Other Departments
The largest hidden costs land in compliance (audit prep), sales (lost same-day deals), and credit risk (verification-attributable defaults). Operations leaders who present the cost-of-manual case using only the operations cost line dramatically understate the true number. The pitch that funds the migration includes all three sister-department costs.
The Pricing Reality on the API Side
API vendor pricing is volume-tiered. At PoC volumes (under 1,000 monthly calls), expect $0.50 to $2.00 per lookup. At 50,000-plus monthly calls, expect $0.10 to $0.30 per lookup, with paid-jurisdiction passthroughs (Delaware corporate detail, paid UCC states) usually billed separately as the underlying state filing fees change without notice.[6] The unit-cost ratio (manual to API) typically runs 10:1 at the cheaper end and 80:1 at the higher end.
What Changes When You Replace Manual Verification with an API?
Six things change materially when manual verification is replaced. The CFO and the leadership team will care about four of them; the verification team will care about all six.
| Dimension | Manual workflow (before) | API workflow (after) |
|---|---|---|
| Time per verification | 5-15 minutes per file | Seconds for fast states; minutes for slow states handled async |
| Same-day funding rate | 40-60 percent (verification bottleneck) | 75-90 percent (verification clears at submission) |
| Audit-artifact completeness | 40-70 percent (manual screenshot capture inconsistent) | 100 percent (artifact generated automatically) |
| Cost per verification | $3-$8 fully loaded | $0.10-$0.50 vendor cost plus residual FTE |
| Verification team role | Rote lookups across 50 state websites | Edge-case analysis, audit-artifact monitoring, threshold calibration |
| Scaling response to volume | Linear; +1 FTE per ~1,000-1,500 monthly applications | Flat; same FTE handles 5-10x volume on edge cases |
The headline numbers (time, cost, same-day funding) sell the migration to leadership. The audit-artifact and team-role changes are what make the migration durable for compliance and operations.
What Does Not Change (Manage Expectations)
Replacement does not eliminate the verification team. Replacement does not eliminate compliance review of edge cases. Replacement does not eliminate the bank-partner third-party-risk review (it makes the review pass cleanly, which is a different thing). Operations leaders who pitch "we can cut the verification team" produce thinner teams, more escalations to underwriters, and worse defect rates. The redirected-FTE pattern is the right operating model.[8]
What Changes for Compliance Specifically
Compliance moves from "assemble audit evidence after the fact" to "review the artifact stream the API produces." The compliance lift drops materially, but the role becomes more strategic: setting confidence-score thresholds, auditing edge-case escalations, and coordinating with the bank-partner third-party-risk team. The compliance officer is a beneficiary of the migration, not a casualty of it.[5]
How Do You Calculate the ROI of Replacing Manual Verification?
The ROI calculation that survives a CFO challenge has five inputs and two outputs. Inputs: monthly application volume, manual time per verification, fully-loaded FTE cost, vendor cost per call, and same-day funding deal-margin recovery. Outputs: monthly cost saving and payback period.
The ROI Worksheet (Conservative)
• Monthly application volume. Use trailing-12-month average, not your aspirational target.
• Time per verification (manual). Use median, not the best-case estimate. 8 minutes is a defensible default if you do not have measured data.
• Fully-loaded FTE cost. Salary times 1.4 to 1.5 to capture benefits, overhead, and management. $90K base = $126K-$135K loaded.
• Vendor cost per call. Use mid-tier pricing for your volume. $0.40 per call is defensible for a 5,000-15,000 monthly volume tier.
• Same-day funding recovery. Conservative: 0.5 deals per analyst-FTE per week recovered, valued at average deal margin. Aggressive: 1-2 deals per FTE per week.
For a 5,000-application-per-month MCA shop with two verification FTEs at $130K loaded each, 8 minutes per file manually, $0.40 per API call, and 0.5 same-day deals per FTE per week recovered at $1,500 margin per deal, the conservative monthly saving lands around $20,000-$30,000 with payback inside three months. The numbers vary by shop; the structure of the calculation is the same.
The Three Numbers the CFO Will Push Back On
First, time per verification: CFOs will argue your team is faster than 8 minutes. Counter with the median, not the best case, and include the parallel-screenshot-capture step. Second, fully-loaded FTE cost: CFOs will argue benefits and overhead should not be in the unit cost. Counter that those costs are real and incremental volume requires incremental FTE. Third, same-day funding recovery: CFOs will argue this is speculative. Counter with the deal-velocity baseline you measured before migration; if you did not measure it, defer this to a year-one realized number rather than including it in the upfront ROI.
Why a Conservative ROI Beats an Aggressive One
A migration projected to save $50K per month and delivering $30K is a problem at the 90-day review. A migration projected to save $20K per month and delivering $30K is a renewed budget. Operations leaders who are asking for budget approval for the first time in this category should under-promise and over-deliver. The category supports the conservative case easily.
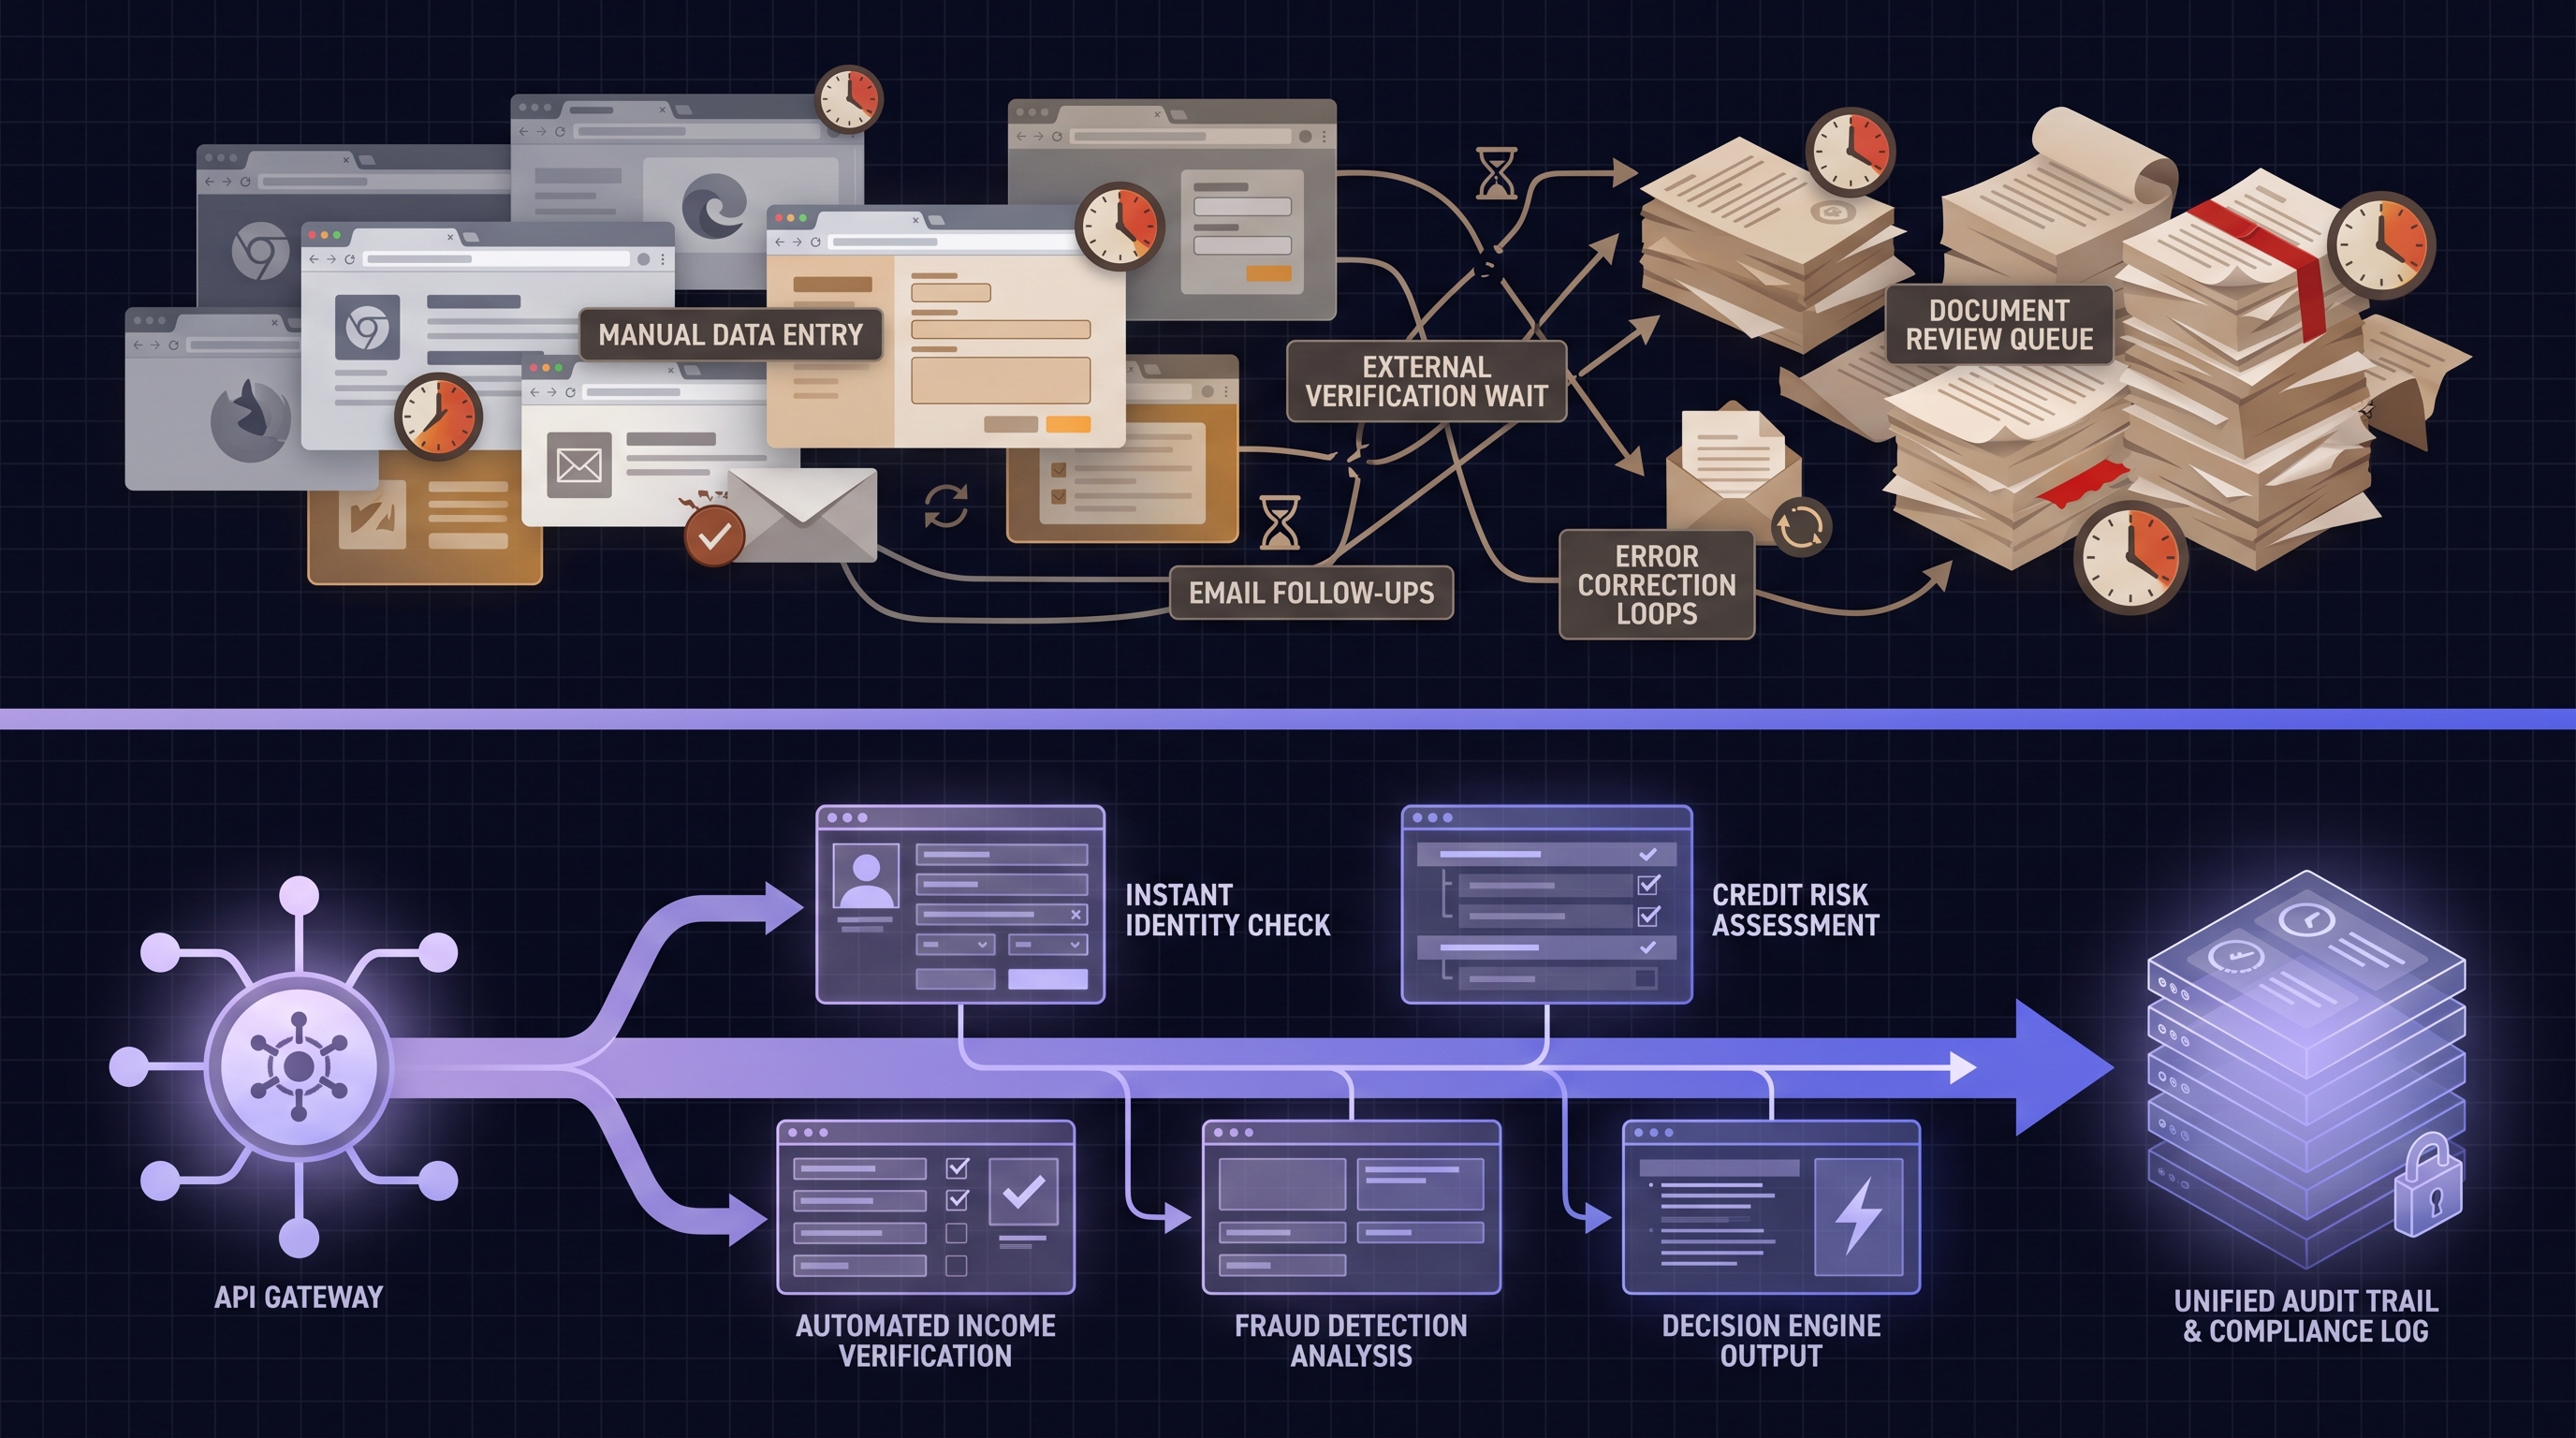
What Are the Workflow Differences Before and After Replacement?
The workflow comparison is the clearest single artifact for executive presentations. The before-state is recognizable to anyone who has worked in lending operations; the after-state is what the migration produces.
The Before-State Workflow (Manual)
1. Application submitted; verification analyst pulls the file.
2. Analyst opens the formation state's SoS website, runs entity search, captures screenshot, pastes into Salesforce.
3. Analyst opens the UCC search for the same state, runs debtor query, manually inspects each filing for collateral overlap with MCA receivables pattern.
4. Analyst opens Treasury OFAC website, runs entity name search, captures screenshot.
5. Analyst submits TIN match request, waits for response, copies match boolean into Salesforce.
6. Analyst flags any anomalies for compliance review.
7. Underwriter picks up the file; verification packet is in Salesforce as scattered screenshots.
The After-State Workflow (API)
1. Application submitted; the verification chain fires automatically at submission.
2. API returns a structured response within seconds for fast states; slow states fire later via webhook.
3. Loan-management system displays the normalized verification packet (entity status, UCC depth, OFAC match, TIN boolean) with confidence scores and source URLs.
4. If any leg returns below confidence threshold or surfaces a flag, the loan-management system routes to the verification analyst for edge-case review.
5. Underwriter picks up the file; verification packet is structured data, not scattered screenshots.
6. Compliance reviews the artifact stream on a sample basis; full audit packet exports on demand.
Related guides on Cobalt's verification stack: How to Automate Business Verification for Lending, How Do Lenders Verify UCC Filings and State Registrations Automatically?, and Best Business Data APIs for U.S. Company Verification.
What Risks Disappear When Manual Verification Is Replaced?
Risk reduction is the most under-pitched benefit of replacement and the one that carries the most weight with bank partners and compliance leadership. Five risks materially reduce when manual verification is replaced.
• Audit-artifact gap risk. Manual screenshot capture is inconsistent. The API artifact is structural, not aspirational. State examiners and bank-partner third-party-risk reviewers cannot find gaps in the artifact stream that does not have gaps.
• Verification-miss default risk. Common-name collisions, dissolved entities returned as active, and missed UCC filings are a measurable defect-rate driver. Replacement reduces this 50 to 80 percent.
• MCA stacking risk. Active UCC filings against future receivables flagged at submission rather than discovered at default. The single largest avoidable-default driver in the MCA category disappears.[4]
• OFAC and BOI risk. Entity-only OFAC screening misses beneficial-owner matches; BOI verification has been through court challenges and operates under voluntary-filing posture.[9] The API workflow surfaces these flags at submission rather than after a regulator asks.[3]
• Concentration risk on tribal knowledge. Manual workflows depend on senior analysts who know the state-specific quirks. The API workflow encodes those quirks in software, removing the dependency on individual team members.
What Compliance Risk Looks Like After Replacement
Compliance risk does not disappear. It transforms. The new risks are calibration risks (confidence-score thresholds set too loose, edge-case escalation paths under-documented) rather than data-completeness risks. Both kinds of risk are manageable; the API ones are easier to monitor because they show up in the metrics rather than in the audit findings.[7]
How Do You Make the Business Case to Executive Leadership?
The case-to-leadership document has five sections. Operations leaders who structure the pitch this way get the budget approved at the first or second meeting. Operations leaders who skip sections (especially the bank-partner risk section) tend to spend three or four cycles before approval.
1. The trigger. Why now? Bank-partner pressure, audit finding, deal-velocity loss to competitors, headcount freeze with rising volume. Specific, recent, and external.
2. The cost of doing nothing. Fully loaded manual cost, audit gap, defect rate, deal-velocity drag. Use measured numbers, not estimates.
3. The replacement option. Vendor selection criteria (do not name a vendor yet), build-vs-buy framing, expected unit-cost reduction.
4. The migration plan. 12-16 week timeline, four phases, dedicated owner, KPI plan, decommissioning approach. Show the leadership team you have thought past procurement.
5. The risk assessment. What can go wrong (slow rollout, edge-case escalation rate higher than expected, bank-partner negotiation friction) and the mitigation for each.
What to Show, What to Hide
Show the unit-economics table, the workflow comparison, and the risk assessment. Hide the vendor-selection details (those are procurement-team noise to a CFO) and the technical integration plan (engineering's problem). The pitch is about the operations decision, not the technology decision.
What Does a Successful Replacement Look Like in the First Year?
Year-one milestones the leadership team should hold operations accountable to:
• Month 3. Pilot complete; confidence thresholds calibrated; compliance signed off on the artifact format.
• Month 4. Full production live; manual workflow decommissioned for routine verifications; same-day funding rate at or above 70 percent.
• Month 6. First quarterly review. Defect-rate trend visible, FTE redirection complete, bank-partner third-party-risk file refreshed with the new artifact pattern.
• Month 9. Second quarterly review. Edge-case workflow stable; review-queue depth managed; vendor SLA performance reported.
• Month 12. Year-one review. Cost-per-verification within 10 percent of projection; same-day funding rate sustained; defect-rate reduction quantified; compliance audit clean.
The Year-One Mistakes to Avoid
Three patterns predict a stalled year-one. First, declaring victory at month 4 and rotating the project owner; the new workflow needs sustained operations attention through month 12. Second, optimizing for cost-per-call and ignoring defect-rate calibration; cheap calls that produce wrong matches cost more than slightly more expensive calls that match correctly. Third, under-investing in the verification team's role transition; team attrition in months 3 to 6 is the most common operational failure mode.


.png)