


Executive Summary: Automating business verification for lending is not a procurement decision; it is an operations migration. Most rollouts that stall do so because the team measured the wrong things before they started, sequenced the rollout in the wrong order, or treated the verification analysts as collateral rather than as the team running the new workflow. This playbook walks through the four-phase migration (baseline, pilot, cohort rollout, full production), the throughput and unit-economics numbers a Director of Operations should expect at each phase, the change-management steps that determine whether the team adopts or resists, and the 90-day KPI plan that proves automation is actually working rather than just running.
How to Automate Business Verification for Lending: A 2026 Operations Playbook
Verification automation looks like a vendor problem from procurement and like a people problem from operations. The vendor decision is real but it is the smaller half. The bigger half is sequencing the migration so the verification team, the underwriters, the compliance reviewers, and the loan-management system all hit production-ready on the same week, with the same KPIs, and a documented fallback when something breaks.
The four-phase migration that consistently lands cleanly across alternative lenders, equipment finance shops, and B2B credit teams:
1. Baseline. Measure the current manual workflow before you change anything. Two weeks of clean data on time-per-verification, FTE allocation, defect rate, and audit-artifact completeness. Without this, the after-state has no honest comparison.
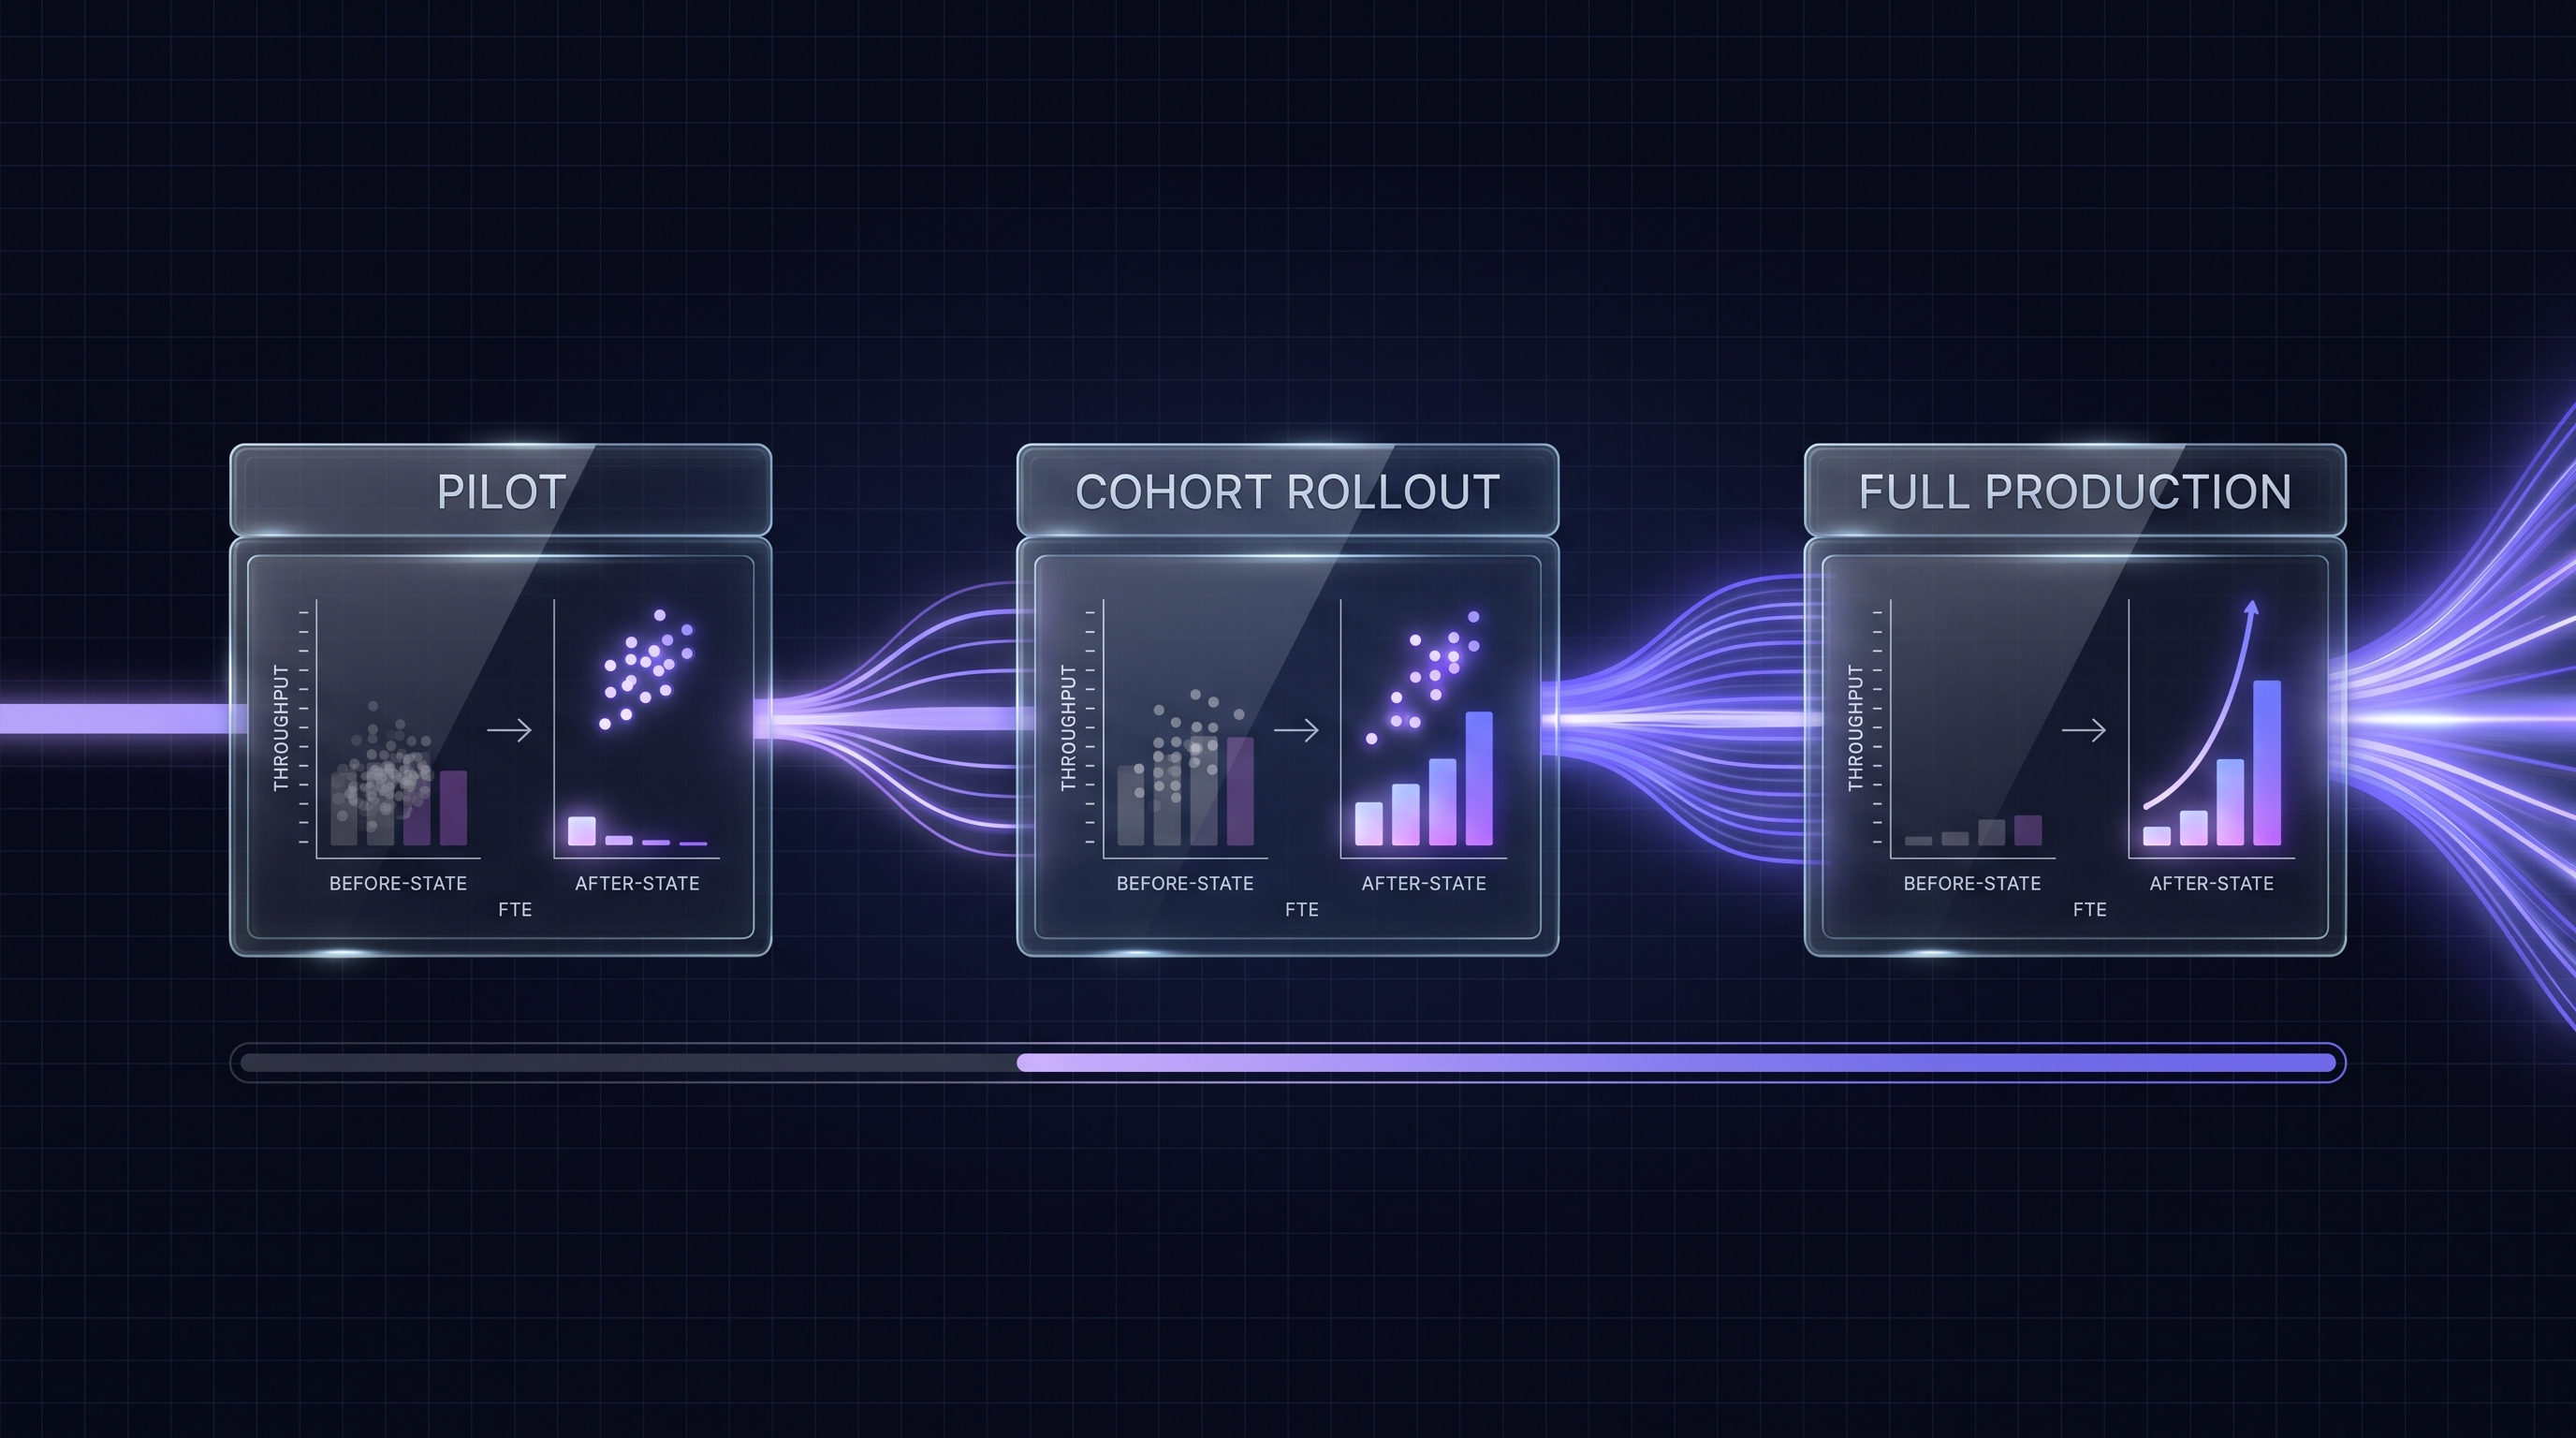
2. Pilot. Run the chained API on a single product line or a single state cluster (typically the top three formation states) for two to four weeks while the manual process continues to run in parallel. Pilot is for shaking out integration bugs and calibrating confidence-score thresholds, not for ROI proof.
3. Cohort rollout. Move workflows over in scheduled cohorts: states first, products second, channel partners third. Each cohort gets a one-week settle period before the next cohort starts. The verification team transitions from "doing manual lookups" to "handling edge cases the automation surfaces."
4. Full production. Manual workflow is decommissioned, the verification team has reshaped responsibilities (more edge cases, more audit-trail review, fewer routine lookups), and the 90-day KPI plan is running.[11]
This piece walks each phase. It assumes a vendor has been selected (Cobalt Intelligence as the primary-source data layer, optionally a KYB orchestration platform on top) and the technical integration is in flight. The operations-side decisions are what determines whether the rollout earns the throughput numbers procurement promised the budget committee.
Why Operations Owns the Migration, Not Engineering
Engineering owns the integration. Operations owns the migration. The distinction is load-bearing: a clean integration that ships into a team that has not had its workflow redesigned, its KPIs reset, or its responsibilities reshaped will produce the same throughput numbers as the manual process for the first six months. Operations leaders who treat the rollout as an engineering project end up with the bill for the vendor and none of the ROI.[2]
Why Compliance Has to Be in the Room From Phase 1
The verification artifact the new workflow produces (source URL, timestamped screenshot, normalized status) is the compliance artifact too. Compliance reviewers need to see the artifact during the pilot, not after full production, so retention rules, audit-export formats, and threshold documentation are agreed on before the migration locks them in.[7]
What Should You Measure Before You Automate?
The two-week baseline is the most underspent step in this category. Operations leaders that skip it end up with anecdotal claims about how much faster the new workflow is and no defensible numbers for the budget committee. Run the baseline before procurement signs the contract if possible; if not, run it before integration goes live.
The metrics that matter:
• Time-per-verification, by state. Median and 95th percentile for each state your portfolio touches. Top-volume states (Texas, California, Florida, New York, Delaware) and the long-tail (Oregon, Wyoming, Montana) behave very differently and the average hides it.
• FTE allocation. How many people, what fraction of their time, doing verification work specifically (not blended with other underwriting tasks). The ROI calculation lives or dies on this number.
• Defect rate. Of last quarter's defaults and write-offs, how many traced back to a verification miss (wrong entity match, missed UCC, dissolved entity returned as active)? This is the fraud-detection ROI baseline.
• Audit-artifact completeness. What fraction of last year's verification records have a usable source URL, timestamp, and screenshot today? Most pre-automation manual workflows score poorly here, and the gap is the compliance ROI baseline.
• Same-day funding rate. Of applications submitted, what fraction reach an approval decision within the same business day? This is the deal-velocity baseline.
• Throughput ceiling. What is the maximum number of applications per day the current manual team can process before quality slips? This is the scale-without-headcount baseline.
Run the measurement on your actual current workload, not a sample. Two weeks is enough to capture weekly cycles. Anything shorter is noise.
Why Defect-Rate Baseline Matters Most
Throughput improvements get the budget approved. Defect-rate improvements get the budget renewed. A six-month review that shows verification automation cut defaults traceable to verification misses by 30 percent is the number that survives the next budget cycle. Without a defect-rate baseline before migration, that number cannot be calculated honestly.
What Tools You Need for the Baseline
A spreadsheet is fine. The team timestamps each verification at start and end, logs the state and outcome, flags any escalations, and notes which audit-artifact fields were captured. Two weeks of disciplined logging produces a credible baseline. Tools that automate this measurement exist and are nice; they are not necessary.
How Do You Phase the Rollout (Pilot → Cohort → Full)?
The phased rollout sequence is the difference between a clean migration and a stalled one. The right sequence is determined by where the operational risk lives, not where the engineering convenience lives.
The Pilot Phase (Weeks 1 to 4)
Pick one state cluster (the top three by volume) and one product line for the pilot. Run the chained API in parallel with the manual process. The verification team continues to do the manual workflow as the system of record; the automation runs alongside, producing comparison data. Pilot success criteria:
• Match accuracy 95 percent or better against the manual baseline on the pilot sample.
• Confidence-score thresholds calibrated so that 90 percent of automation results auto-route, 8 to 9 percent surface for human review, and 1 to 2 percent reject for "needs more data."
• Audit-artifact completeness 100 percent on the pilot sample. Every record has source URL, timestamp, and screenshot.
• Compliance sign-off on the artifact format and retention pattern.[8]
Pilot is not the place to prove ROI. It is the place to shake out integration bugs, calibrate thresholds, and earn the team's trust. Operations leaders that try to use pilot data as the budget-committee number end up with thin samples and contested results.
The Cohort Rollout Phase (Weeks 5 to 12)
After pilot completes cleanly, expand in scheduled cohorts:
• State cohorts first. Add the next 5 to 10 states each week, with a one-week settle period before the next cohort. Long-tail states with async-only behavior (Oregon, Vermont) get their own cohort late in the sequence.
• Product cohorts second. If the lender runs multiple products (MCA, equipment finance, invoice factoring), migrate each product line as its own cohort.
• Channel partner cohorts third. If applications come through brokers or referral partners, migrate channels last, because their integration touchpoints are the most fragile.
Each cohort transitions the verification team from manual on that cohort to "edge case review" on that cohort. The team is reshaping its responsibilities week by week, which is harder than it sounds and is the part most rollouts underestimate.
The Full Production Phase (Weeks 12+)
Manual workflow is decommissioned (formally, with announcement and timeline) and the new workflow is the system of record. The 90-day KPI plan kicks in. The verification team has reshaped responsibilities and the operations leader is reporting the throughput-and-unit-economics numbers to the leadership team monthly.
What Are the Real Throughput and Cost Numbers Operations Teams Should Expect?
Throughput and unit-economics expectations vary by starting point, but the patterns are consistent across alternative lenders that have completed the migration. Honest ranges:
| Metric | Pre-automation baseline | Post-automation expectation |
|---|---|---|
| Median time per verification | 5 to 15 minutes (manual SoS + UCC + OFAC + screenshot) | Seconds for fast states; minutes for slow states handled async |
| FTE allocation | 1 FTE per ~1,000 to 1,500 monthly applications | Same FTE handles 5 to 10x volume on edge cases plus audit review |
| Same-day funding rate | 40 to 60 percent (verification is the bottleneck) | 75 to 90 percent (verification clears at submission) |
| Cost per verification | $3 to $8 fully loaded (FTE + overhead) | $0.10 to $0.50 (vendor cost) plus residual FTE cost on edge cases |
| Audit-artifact completeness | 40 to 70 percent (manual screenshot capture is inconsistent) | 100 percent (artifact is generated automatically) |
| Defect rate (verification misses) | 1 to 3 percent of defaults trace to verification miss | 0.2 to 0.5 percent (most misses are now edge cases the team caught) |
The throughput numbers in the table are what the migration earns over 6 to 9 months once the team has reshaped responsibilities. They are not what the migration earns in week one. Operations leaders that promise the budget committee the post-automation numbers in month one set themselves up for an ROI shortfall report at the 90-day review.
Why FTE Reduction Is Usually the Wrong Goal
The cleanest migrations do not reduce verification headcount; they redirect it. The FTE that used to do manual SoS lookups now handles edge cases (ambiguous matches, async returns from slow states, pulled-screenshot audit reviews) plus dedicated audit-artifact monitoring. That role is more skilled, more defensible to compliance, and produces meaningfully better risk outcomes than the automated workflow plus a thinner team would. The headcount-reduction goal is a CFO-facing pitch; the redirected-FTE pattern is the operationally durable answer.
The Pricing Reality Procurement Should Walk In Knowing
Vendor pricing is volume-tiered. At PoC volumes (under 1,000 monthly calls), expect $0.50 to $2.00 per lookup. At 50,000-plus monthly calls, expect $0.10 to $0.30 per lookup, with paid-jurisdiction passthroughs (Delaware corporate detail, paid UCC states) usually billed separately as the underlying state filing fees change without notice.[6] Vendors that will not quote ranges before the call have something to defend in the answer.
How Do You Manage the Change With Your Verification Team?
The change-management piece is what separates rollouts that earn the throughput numbers from rollouts that do not. The verification team has been doing the manual work as the system of record for years. They know the failure modes, the state-specific quirks, and the edge cases. They are also the team most directly affected by automation. The migration that respects this builds trust; the migration that sidelines them produces resistance, longer rollout timelines, and avoidable quality regressions.
Why the Verification Team Should Help Calibrate Thresholds
The verification team has the tribal knowledge to set confidence-score thresholds correctly. They know which name patterns produce common-name collisions, which states have notoriously bad data hygiene, and which application channels generate the most fraud-pattern applications. Bringing them into the threshold-calibration step during pilot earns three things: more accurate thresholds, faster team adoption, and a documented credit-policy artifact that survives audit review.
How to Reshape Roles Without Triggering Attrition
The team move from "manual lookups" to "edge case review and audit monitoring" is a real role change. Three patterns reduce attrition:
• Title and compensation review. The new role is more skilled. Recognize that with a title and salary review at the migration milestone, not 12 months later.
• Cross-train into adjacent functions. If the new role takes 60 percent of the FTE's time, fill the remainder with cross-training into underwriting analysis, fraud investigation, or compliance review. The team grows; it does not shrink.
• Document the new responsibilities formally. A written role description, KPI set, and escalation path before full production starts. Verbal handoffs produce ambiguity, and ambiguity produces resistance.
What KPIs Tell You Automation Is Working (And Which Are Vanity Metrics)?
Three KPIs prove automation is working. Three more are vanity metrics that look impressive on a dashboard and tell you nothing.
The Three KPIs That Matter
• Same-day funding rate. Percentage of applications that reach an approval decision within the same business day. Track weekly; expect a 25 to 40 percentage-point lift after full production.
• Cost per verified application, fully loaded. Vendor cost plus residual FTE cost plus loaded overhead. Track monthly. The number that matters to the CFO.
• Defect rate (verification-attributable defaults). Of defaults in the cohort, what fraction trace to a verification miss. Track quarterly; expect a 50 to 80 percent reduction.
The Three Vanity Metrics
• "Number of API calls per month." Tells you the integration is running. Tells you nothing about whether it is producing better outcomes.
• "Average response time." Hides the 95th percentile, which is where the real operational pain lives. Track 95th percentile per state instead.
• "Verification team headcount reduction." Optimizing for this number produces a thin team, more edge-case escalations to underwriters, and a worse defect rate. The redirected-FTE pattern is the right operating model.
Related guides on Cobalt's verification stack: Best Business Data APIs for U.S. Company Verification, How Do Lenders Verify UCC Filings and State Registrations Automatically?, and Best API for Lending Compliance and Audit Trails in Fintech.
How Do You Handle Edge Cases the Automation Will Not Cover?
No verification chain handles 100 percent of applications cleanly. The cleanly-handled fraction in production typically lands at 88 to 94 percent of total volume. The remaining 6 to 12 percent is edge cases, and the operations playbook for handling them is what determines whether the team trusts the new workflow or quietly maintains shadow manual processes.
The Five Edge-Case Patterns
• Common-name collisions. "Smith Trucking LLC" returns four entities. The chain returns candidate matches with confidence scores; the team picks the right one based on application context (DBA, address, application channel).
• Async returns from slow states. Oregon, Vermont, and a few others can take minutes. The chain produces a retry ID and webhook callback; the team's loan-management system handles the partial-completion routing.
• Newly-formed entities. An entity formed less than 30 days before application is a higher-fraud-risk pattern in MCA workflows.[1] The chain flags formation date; the team applies a stricter threshold and reviews the secured-party history under UCC Article 9 rules to confirm there is no pre-existing receivables pledge from a prior funder.[4]
• Multi-state operations. An entity formed in Delaware operating in California; the chain runs lookups in both states; the team confirms which is the right authoritative record for the loan file.
• State outages. NY rolling outages, CA captcha changes, Oregon load delays. The chain handles outages with documented fallback (queued retry, manual review hold); the team monitors the queue.
Why Edge-Case Documentation Is the Audit Defense Asset
State examiners and bank-partner third-party-risk reviewers want to see how the verification team handles edge cases, not how the chain handles the happy path.[5] A documented edge-case playbook (when to escalate, who decides, what evidence is captured) is the audit-defense asset that turns "we automated verification" from a liability question into a procedural strength.
What Should an Operations Lead Do in the First 90 Days After Go-Live?
The 90-day post-go-live plan is what converts a successful migration into a sustained operational capability. The wrong move is to declare victory at week 12 and rotate to the next project. The right move is to run a structured 90-day stabilization plan with weekly reviews, monthly KPI reports, and a quarterly board-level update.
1. Week 1 to 2. Daily standup with the verification team to surface integration bugs, threshold-calibration issues, and edge-case patterns. Track each issue with owner and resolution date.
2. Week 3 to 6. Weekly KPI review. Same-day funding rate, cost per verification, audit-artifact completeness. Flag any KPI not on its expected trajectory.
3. Week 7 to 12. Monthly KPI report to leadership. Confirm the throughput numbers projected to the budget committee are landing. Surface any gap with a remediation plan, not a complaint.
4. Quarterly review. Board-level summary: defect rate before and after, FTE redirection, same-day funding rate, audit-artifact completeness, vendor performance against SLA. The quarterly review is what protects the budget renewal.
Operations leaders that run this plan finish the 90-day window with the team running the new workflow as the system of record, the leadership team confident in the migration, and compliance signed off on the audit packet. Operations leaders that skip the structured plan typically spend month 6 explaining why the throughput numbers regressed.[10]
What to Do When the Numbers Stall
Two patterns stall mid-migration. First, the verification team has not actually reshaped responsibilities and is still doing shadow manual lookups; the symptom is FTE allocation that did not change. Second, the orchestration layer surfaces too many false positives to the team for review, drowning the edge-case workflow in noise; the symptom is rising review-queue depth. Both are calibration problems and both are fixable in two weeks of focused work; neither is a vendor problem.
Why the OFAC and BOI Pieces Stay Manual Longer Than You Expect
OFAC screening on entity name automates cleanly. OFAC against verified beneficial owners requires a defensible process for resolving partial matches; many teams keep the final OFAC adjudication step manual for the first 6 to 12 months even after the rest of the chain is fully automated.[3] Similarly, BOI verification has been through court challenges and is operating under a voluntary-filing posture for domestic reporting companies; the operations playbook should treat BOI as captured-and-stored data with manual final review until enforcement posture stabilizes.[9]


.png)